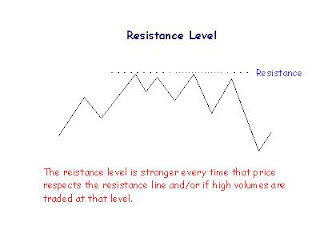
Resistance is the price level at which selling is thought to be strong enough to prevent the price from rising further and the logic dictates that as the price advances towards resistance, sellers become more inclined to sell and buyers become less inclined to buy. By the time the price reaches the resistance level, it is believed that supply will overcome demand and prevent the price from rising above resistance.
The market has a memory. When price makes a new High and then retreats, sellers who missed the previous peak will be inclined to sell when price returns to that level. Afraid of missing out a second time, they may enter the market in numbers sufficient to overwhelm buyers. The resulting correction will reinforce market perceptions that price is unlikely to move higher and establish a resistance level. Resistance does not always hold and a break above resistance signals that the bulls have won out over the bears. A break above resistance shows a new willingness to buy and/or a lack of incentive to sell. Resistance breaks through and new highs are made that would indicate that buyers have increased their expectations and are willing to buy at even higher prices. In addition, sellers could not be tempted into selling until prices have rallied above resistance or above the previous high. Once resistance is broken, another resistance level will have to be established at a higher level. Another principle of technical analysis stipulates that support can turn into resistance and visa versa. Once the price breaks below a support level, the broken support level can turn into resistance. The break of support signals that the forces of supply have overcome the forces of demand. Therefore, if the price returns to this level, there is likely to be an increase in supply, and hence resistance. The other side is resistance turning into support. As the price advances above resistance, it signals changes in supply and demand. The breakout above resistance proves that the forces of demand have overwhelmed the forces of supply. If the price returns to this level, there is likely to be an increase in demand and support will be found. Therefore we first plot long-term charts and begin by analyzing the daily and weekly charts going back for a couple of years. This provides more visibility and a better long-term perspective on a market. Once the long-term has been has been established then review the daily and the intra-day charts. A short-term market view alone can often be deceptive. Even if you only trade the very short term, you will do better if you're trading in the same direction as the intermediate and longer-term trends. Take in the general view of the chart to determine the direction of the trend, and follow it. We need to try to identify support and resistance levels, the best place to buy a market is near support levels that support is usually a previous reaction low. The best place to sell a market is near resistance levels. Resistance is usually a previous peak. After a resistance peak has been broken, it will usually provide support on subsequent pullbacks. In other words, the old "high" becomes the new "low." In the same way, when a support level has been broken, it will usually produce selling on subsequent rallies -- the old "low" can become the new "high." It is very important to make sure that we trade in the direction of that trend. We “Buy dips if the trend is up” and “Sell rallies if the trend is down” But in each case, let the bigger time frame chart determine the trend, and then use the shorter-term chart for timing entry. Find support and resistance levels; the best place to buy a market is near a support level, and that support is usually a previous reaction low. The best place to sell a market is near resistance levels. Resistance is usually a previous peak. After a resistance peak has been broken, it will usually provide support on subsequent pullbacks. In other words, the old "high" becomes the new "low." In the same way, when a support level has been broken, it will usually produce selling on subsequent rallies -- the old "low" can become the new "high." Stops are best placed after we first identify support and resistance on the charts and you place yours stop beyond those levels and at that time you decide if the risk reward on the trade is acceptable to you When price makes a new High and then retreats, sellers who missed the previous peak will be inclined to sell when price returns to that level. Afraid of missing out a second time, they may enter the market in numbers sufficient to overwhelm buyers. The resulting correction will reinforce market perceptions that price is unlikely to move higher and establish a resistance level.

Tidak ada komentar:
Posting Komentar